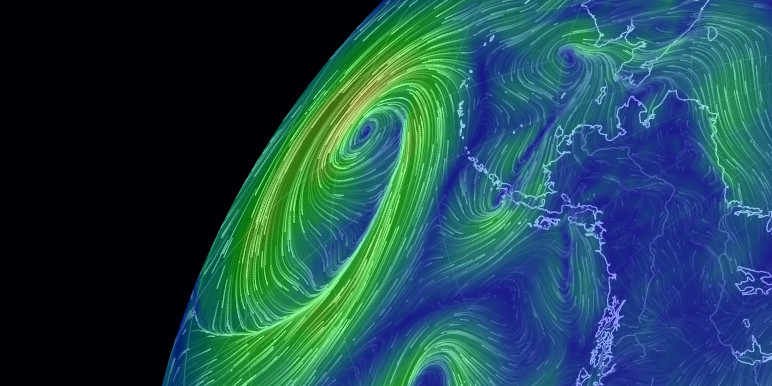
nullschool earth
uma visualização das condições de climaticas globais
boletins gerados por supercomputadores
atualizados a cada três horas
estimativas das correntes de superfície do oceano
atualizado diariamente
temperaturas de superfície do oceano e
anomalia da média diária (1981-2011)
atualizada diariamente
ondas do oceano
atualizadas a cada três horas
aurora
atualizada a cada trinta minutos
Criado por
Cameron Beccario -
@cambecc.nullschool.net
Nullschool Technologies Inc.
Comunidade
- Newsletter
- news.nullschool.net
- EarthWindMap
- YouTube
- @nullschool-tech
- @nullschool
feedback
enviar feedback sobre este site
Contato
para licenciamento ou outras dúvidas, contate inquiries@nullschool.net
Fontes de dados
Este produto não existiria sem o fluxo contínuo de dados de ciências da Terra produzidos por cientistas e engenheiros de agências governamentais e laboratórios de pesquisa em todo o mundo.
- Dados meteorológicos
-
GFS (Global Forecast System)
EMC / NCEP / NWS / NOAA - Dados de correntes do oceano
-
OSCAR v2.0
Earth & Space Research
Global Ocean Physics Analysis and Forecast
E.U. Copernicus Marine Service Information (CMEMS). Marine Data Store (MDS). DOI: 10.48670/moi-00016 - Temperatura de Superfície do Mar
-
OI SST (Optimum Interpolation Sea Surface Temperature) V2.1
NOAA Physical Sciences Laboratory, Boulder, Colorado, USA
observação: os dados de OI SST são preliminares se tiverem menos de duas semanas e podem mudar
OSTIA (Operational Sea Surface Temperature and Sea Ice Analysis)
UK Met Office + GHRSST + E.U. Copernicus Marine Service Information (CMEMS)
RTGSST (Real Time Global Sea Surface Temperature)
MMAB / EMC / NCEP / NWS / NOAA - Ondas do oceano
-
WAVEWATCH III
MMAB / EMC / NCEP / NWS / NOAA - Área de alerta de branqueamento
- Coral Reef Watch / NOAA
- Aerossóis e química
-
GEOS-5 (Goddard Earth Observing System)
GMAO / NASA
CAMS (Copernicus Atmosphere Monitoring System)
Copernicus / European Commission + ECMWF - Aurora
-
OVATION
SWPC / NCEP / NWS / NOAA
Processing script written by Stephanie Deppe, PhD (profile) - Índice UV e taxa de dose eritemal
- Climate Prediction Center / NCEP / NWS / NOAA
- Incêndios ativos
-
Fire Information for Resource Management System (FIRMS) / EOSDIS / NASA
(veja a discussão abaixo)
Bibliotecas e serviços
- Biblioteca de projeção e visualização geográfica
- D3
- Bibliotecas de código aberto
- Ver créditos e licenças
- Dados geográficos
- Natural Earth
- Decodificador de GRIB/NetCDF
- NSF Unidata netcdf-java
- Hospedagem
-
Cloudflare
Amazon S3
Backblaze B2
Digital Ocean - Fontes
-
M+ FONTS
Google Noto Fonts - Ícones
- Font Awesome Free by @fontawesome - CC BY 4.0
- Escalas de Cores
-
ColorBrewer2.org
Kindlmann Linear Luminance
MYCARTA
Dave Green's cubehelix - Versão gratuita do código fonte
- github.com/cambecc/earth
acknowledgements
- Inspiração
- HINT.FM wind map
- Protótipo
- air.nullschool.net
Sobre os dados
A camada de "Superfície" representa as condições no terreno ou do nível da água
esta camada segue os contornos das montanhas, vales, etc.
as sobreposições mostram outra dimensão dos dados usando cor
algumas sobreposições são válidas em uma altura específica
enquanto outras são válidas para toda a espessura da atmosfera
- Vento
- velocidade do vento na altura especificada
- Temp
- temperatura na altura especificada
- UH
- umidade relativa na altura especificada
- WBT
-
temperatura de bulbo úmido a 2 m acima da superfície
calculado a partir da temperatura de bulbo seco do GFS, da temperatura do ponto de orvalho e das variáveis de pressão usando a abordagem de Brice e Hall - Orvalho
- temperatura do ponto de orvalho a 2 m acima da superfície
- WPD
-
Densidade instantânea do vento
medida da potência disponível no vento: ½ρv3, onde ρ é a densidade do ar e v é a velocidade do vento - TAP
-
Total Precipitable Water
quantidade total de água em uma coluna de ar que se estende do solo ao espaço - TAN
-
Total de água na nuvem
quantidade total de água nas nuvens em uma coluna de ar da terra para o espaço - 3AP
-
Acúmulo de precipitação em 3 horas
quantidade de precipitação nas próximas três horas - CAPE
-
Energia Potencial Convectiva Disponível
indica o empuxo do ar, uma medida da instabilidade atmosférica e indicador de tempo severo - MSLP
-
Pressão ao nível do mar
pressão de ar reduzida ao nível do mar - MI
-
Índice de Desconforto Térmico
temperatura do ar percebida como combinação de índice de calor e sensação térmica por vento - UVI
-
Índice UV
risco de danos pela exposição solar sem proteção devido à intensidade da radiação ultravioleta (UV) que causa queimaduras
- 0 - 2
- baixa
- 3 - 5
- moderado
- 6 - 7
- alta
- 8 - 10
- muito alta
- 11+
- extremo
- TSM
-
Temperatura de Superfície do Mar
temperatura na superfície do oceano - ATSM
-
Anomalia de Temperatura na Superfície do Mar
RTG-SST: diferença na temperatura do mar de média diária durante anos 1981-2011
OSTIA: calculated from 1981–present Pathfinder climatology
OI SST: calculated from 1971-2000 OI SST V2 climatology - ASO
-
Altura Significativa de Onda
aproximadamente igual a altura de onda, como estimado por um "observador" - BAA
-
Área de alerta de branqueamento (máximo de 7 dias)
Nível de estresse térmico do branqueamento dos corais:- Sem estresse
- Não há estresse térmico nem branqueamento de corais.
- Vigilância de branqueamento
- Há estresse térmico em nível baixo.
- Aviso de branqueamento
- Risco de possível branqueamento. O estresse térmico está se acumulando.
- Nível de alerta 1
- Risco de branqueamento em todo o recife. É provável um branqueamento significativo.
- Nível de alerta 2
- Risco de branqueamento em todo o recife com mortalidade de corais sensíveis ao calor. É provável ocorrer branqueamento severo e morte significativa de corais.
- Nível de alerta 3
- Risco de mortalidade em múltiplas espécies.
- Nível de alerta 4
- Risco de mortalidade severa envolvendo múltiplas espécies (> 50% dos corais).
- Nível de alerta 5
- Risco de mortalidade quase total (> 80% dos corais).
- COsc
-
Concentração de Monóxido de Carbono Superficial
Uma fração de monóxido de carbono presente no ar da superfície da terra - CO2sc
-
Concetração de Dióxido de Carbono na Superfície
uma fração de dióxido de carbono presente no ar da superfície terrestre - SO2sm
-
Massa de Dióxido de Enxofre Superficial
quantidade de dióxido de enxofre no ar próximo à superfície da Terra - NO2
-
Dióxido de nitrogênio
quantidade de dióxido de nitrogênio no ar próximo à superfície da Terra - DUex
-
Extinção de pó
a espessura óptica de aerossol (AOT) da luz em 550 nm devida ao pó - SO4ex
-
Extinção de sulfato
a espessura óptica de aerossol (AOT) da luz em 550 nm devida ao sulfato - PM1
-
Material particulado < 1 µm
massa de partículas atmosféricas com diâmetro inferior a 1 micrômetro - PM2.5
-
Material particulado < 2,5 µm
massa de partículas atmosféricas com diâmetro inferior a 2,5 micrômetros - PM10
-
Material particulado < 10 µm
massa de partículas atmosféricas com diâmetro inferior a 10 micrômetros - OMaot
-
espessura óptica de aerossol de matéria orgânica
a espessura óptica de aerossol (AOT) da luz em 550 nm devida à matéria orgânica suspensa no ar.
Essa camada pode ser interpretada como a espessura da fumaça de incêndios florestais e outras fontes de combustão.
Níveis de pressão
a pressão atmosférica corresponde aproximadamente à altitude
várias camadas de pressão são de interesse meteorológico
elas mostram dados pressupondo que a Terra é completamente lisa
nota: 1 hectopascal (hPa) = 1 milibar (mb)
- 1000 hPa
- 00,~100 m, condições ao nível do mar
- 850 hPa
- 0~1,500 m, camada limite atmosférica, baixa
- 700 hPa
- 0~3,500 m, camada limite atmosférica, elevada
- 500 hPa
- 0~5,000 m, vorticidade
- 250 hPa
- ~10,500 m, corrente de jato
- 70 hPa
- ~17,500 m, estratosfera
- 10 hPa
- ~26,500 m, ainda mais estratosfera
sobre ondas do oceano
A altura significativa de onda é a altura média do terço mais alto das ondas em um determinado ponto do oceano. Há uma ótima explicação aqui descrevendo o que isso significa.
O período de onda de pico é a frequência (inversa) das ondas mais energéticas que passam por um determinado ponto, sejam geradas pelo vento ou por marulhos. É claro que há muitos outros grupos de ondas atravessando uma área, cada um em direções diferentes, mas tentar mostrar todos rapidamente se torna complexo. Em vez disso, mostramos o grupo de ondas que mais contribui com energia. Isso tem o efeito de criar “fronteiras” entre regiões do oceano onde o grupo de ondas nº 1 de repente cai para o segundo lugar. Muitas vezes essas fronteiras representam frentes de marulho, mas em outras ocasiões são apenas artefatos do mecanismo de classificação.
sobre concentrações de CO2
para datas anteriores a 2017-01-24 04:30 UTC
Ao implementar a visualização da concentração de CO2 na superfície, notei que o modelo NASA GEOS-5 relata uma concentração média global que difere significativamente dos números amplamente divulgados. Por exemplo, na execução de 2015-11-23 00:00 UTC, a média global é de apenas 368 ppmv, enquanto observatórios de CO2 reportam concentrações mais próximas de 400 ppmv. O GEOS-5 foi construído nos anos 2000, então talvez o modelo não considere o acúmulo de CO2 atmosférico ao longo do tempo? Isto é apenas uma especulação. Não tenho certeza.
Para aproximar os resultados do GEOS-5 dos números contemporâneos, adicionei um desvio uniforme de +32 ppmv, elevando a média global para 400 ppmv. Isso não é cientificamente válido, mas permite que a visualização seja ilustrativa da discussão atual sobre o CO2 atmosférico. Sem dúvida, eu acolheria uma abordagem mais rigorosa ou uma explicação de por que o modelo GEOS-5 produz os dados que produz.
A partir de 24/01/2017 às 04:30 UTC, esse ajuste não é mais necessário porque o GEOS‑5 aparentemente foi atualizado.
sobre aerossóis e extinção
Um aerossol é ar que contém partículas. As mais comuns são poeira, fumaça, fuligem e gotículas de água (nuvens). Essas partículas afetam a luz solar principalmente por absorção e espalhamento, que juntos reduzem a quantidade de luz que atinge o solo. Essa perda de luz ao atravessar a atmosfera é chamada de extinção.
Uma medida comum de extinção é a espessura óptica de aerossol (AOT), que é (o logaritmo de) a razão entre a potência da luz incidente e a potência da luz transmitida. Isso nos ajuda a entender quão “espesso” está o ar com particulados.
sobre os dados de incêndios ativos
Os dados de incêndio são uma combinação dos produtos de fogo ativo VIIRS 375 m NRT (NOAA‑20) e VIIRS 375 m NRT (Suomi NPP). Cada ponto de detecção de fogo contém o horário da detecção (quando o satélite fez a medição) e a Potência Radiativa do Fogo (FRP), em megawatts (MW). Para saber como interpretar as leituras, consulte a FAQ do FIRMS e a discussão detalhada sobre VIIRS I‑Band 375 m Active Fire Data.
Reconhecemos o uso de dados e/ou imagens do FIRMS – Fire Information for Resource Management System, parte do EOSDIS (Earth Observing System Data and Information System) da NASA.
atalhos do teclado
- e
- mostrar o menu
- escape
- feche a caixa de diálogo/menu
- n
- ir para (data mais recente)
- shift-c
- mostrar o calendário de seleção de data
- j
- voltar vários passos
- shift-j
- voltar vários passos
- k
- ir para a frente
- shift-k
- avançar vários passos
- g
- alternar a grade ligar/desligar
- p
- alternar a animação ligar/desligar
- shift-h
- habilitar/desabilitar modo de alta definição
- shift-t
- mostrar configurações
- i
- subir um nível de pressão
- shift-i
- subir para a estratosfera
- m
- descer um nível de pressão
- shift-m
- descer para a superfície
- d
- aproximar
- shift-d
- aproximar mais rápido
- x
- afastar
- shift-x
- afastar mais rápido
- w
- girar para cima
- shift-w
- girar para cima mais rápido
- z
- girar para baixo
- shift-z
- girar para baixo mais rápido
- a
- girar para a esquerda
- shift-a
- girar para a esquerda mais rápido
- s
- girar para a direita
- shift-s
- girar para a direita mais rápido
tradutores
Александр Попов Вячеслав Епиков 1599763839 1992pb 2451158917 피시 afropolakwot agagey Aleksander Alexander Kirilov Alexey Dmitriev Alexey Korsakov AlexOrlovets Anderson Porto Andre Lz Andrea de Franco Andrew Pedrini Andrey Bagmanov Antonpek arquerogonza Artur Wisniewski ashawesoman ashvin.j.sherathiya astrostrong asveruz atom Belore Stergann bgij bidulem3 Birg3r Bohuslav Šín Bram Versteeve Bryan carina.bringedal carlofrc Cassiel Bclamson Ching-ping Yu Christian Leroux contact cuxcoll Daniel Bartsch Daniel Isak Marinosson Daniel Pawlowski Daniel Rakoczy danielruiz1636 Darlite davalenciano98 Davide Carlier Denat250 deus.05 Dimitris T. Papadimitriou dlo.daniel Dominic Douglas dsantosgtm dustyhofman e Eason Huang egarpunov elier.pila Eric Kim essaii32 estefilippini fantasy_lcl farrasoctara Felipe Faria florian-lerch franci00 FranklinZhang Frederik T. de Ridder fthmiln georg.loesel gherlainfo giacomo.gerosa Gian Centeno giospud gonzalo.ag88 gporter.seadog graceang graham.rimmington grol2901 Hebel holgersson Hyung Wook Jung Ichiro Wang Ignacio Sanz iii1212 InfoSecOne Jae Soo Park Jiří Batelka Joanna Rinne Joao Correia jocelot Jomari Joseph Barrera Jonathan Yang Jose A. Frias Morales juanpaexpedite kai.s.mueller Karol Sapiński Kiyun Jeon kjetil.hoiby kty5663 ku5an2901 laurapaccini leandro1212 leticia.tahnee lretamal Luboš Motl marcello.carreira marco.prosdocimo Mark markeletona Markus Schley Martine Bolzinger Matt Tang Mattia Raffa mavilesilva melfi Melissa Ortiz Massó Meow Wang mgb Michael Purer Michael Michel Rivero mikami_1966.1118 mikele.fit95 Miquel Bayo Moreno mir597 MirageF1AZ Miroslaw Lisiak Mohannad Alahmadi m_strugale nando nunolava1998 Olivier OLS-RU Oğuzhan Arı Paul Bachem Paweł Kowalczyk pdobrev Personim Intaned Philippe Jabet Plamen Dobrev ProffLex P_A_N_D_A_M_A_N Rafael Nonato Bassora rajeshgodvani RaskiPL reyfran8 Riccardo Monfardini robertrosalex Roger Helman Roller978 rosariainpo Russel Schwartz santiago.giraldoc sapan021 sarogrom Seongmin Park september43 Seregalsv Serega silverhaze030 Simone Dragoni siudzin98 skyneon77 sombrasbaul Somil Thesia Stephen Flynn Steven SUGIMOTO Tatsuo Sunny Miu Tayseer M Alhibshi Telmo John tenderstart thanhhuyenlth Thomas Middelveld Thorsten Schleicher tigormal tigra200sx Tomasz Waligóra torstenleibrich tsuka tama ulaszewski.bartosz ultordima Vasily Tarasenko vhc1967 Vu Thuong Víctor Velarde wasted webfreelance Wonmin Jeong wtlovergirl xesmedic xorpid xrdeem xsqz 潘柏綸 yaawwad Yauhen Bahashou youngjune4498 Youngmin Jeon Yukun Chen zackcaussy Zulus Οverlord
Referências
Selecionado para a coleção de recursos educacionais CLEAN (Climate Literacy and Energy Awareness Network).
reclamação
Os dados usados no GEOS-5 foram fornecidos pelo escritório de assimilação (GMAO) na NASA Goddard Space Flight Center e modelagem Global através do portal de dados on-line no centro da NASA para a simulação de clima
Os dados GEOS-5 (cobrindo todas as camadas de Química e Particulados) vêm com o seguinte aviso: As previsões usando o sistema GEOS são experimentais e produzidas apenas para fins de pesquisa. Não é recomendado usar essas previsões para outros fins.
Generated using Copernicus Atmosphere Monitoring Service Information 2017-2020. Neither the European Commission nor ECMWF is responsible for any use that may be made of this information.
clima e oceano de dados gerados a partir de modelos numéricos
A Nullschool Technologies Inc. não oferece garantia de exatidão
Copyright (c) 2026 Nullschool Technologies Inc.